Defect management heat map example
This template works on the following products:

*For Team and Enterprise plans
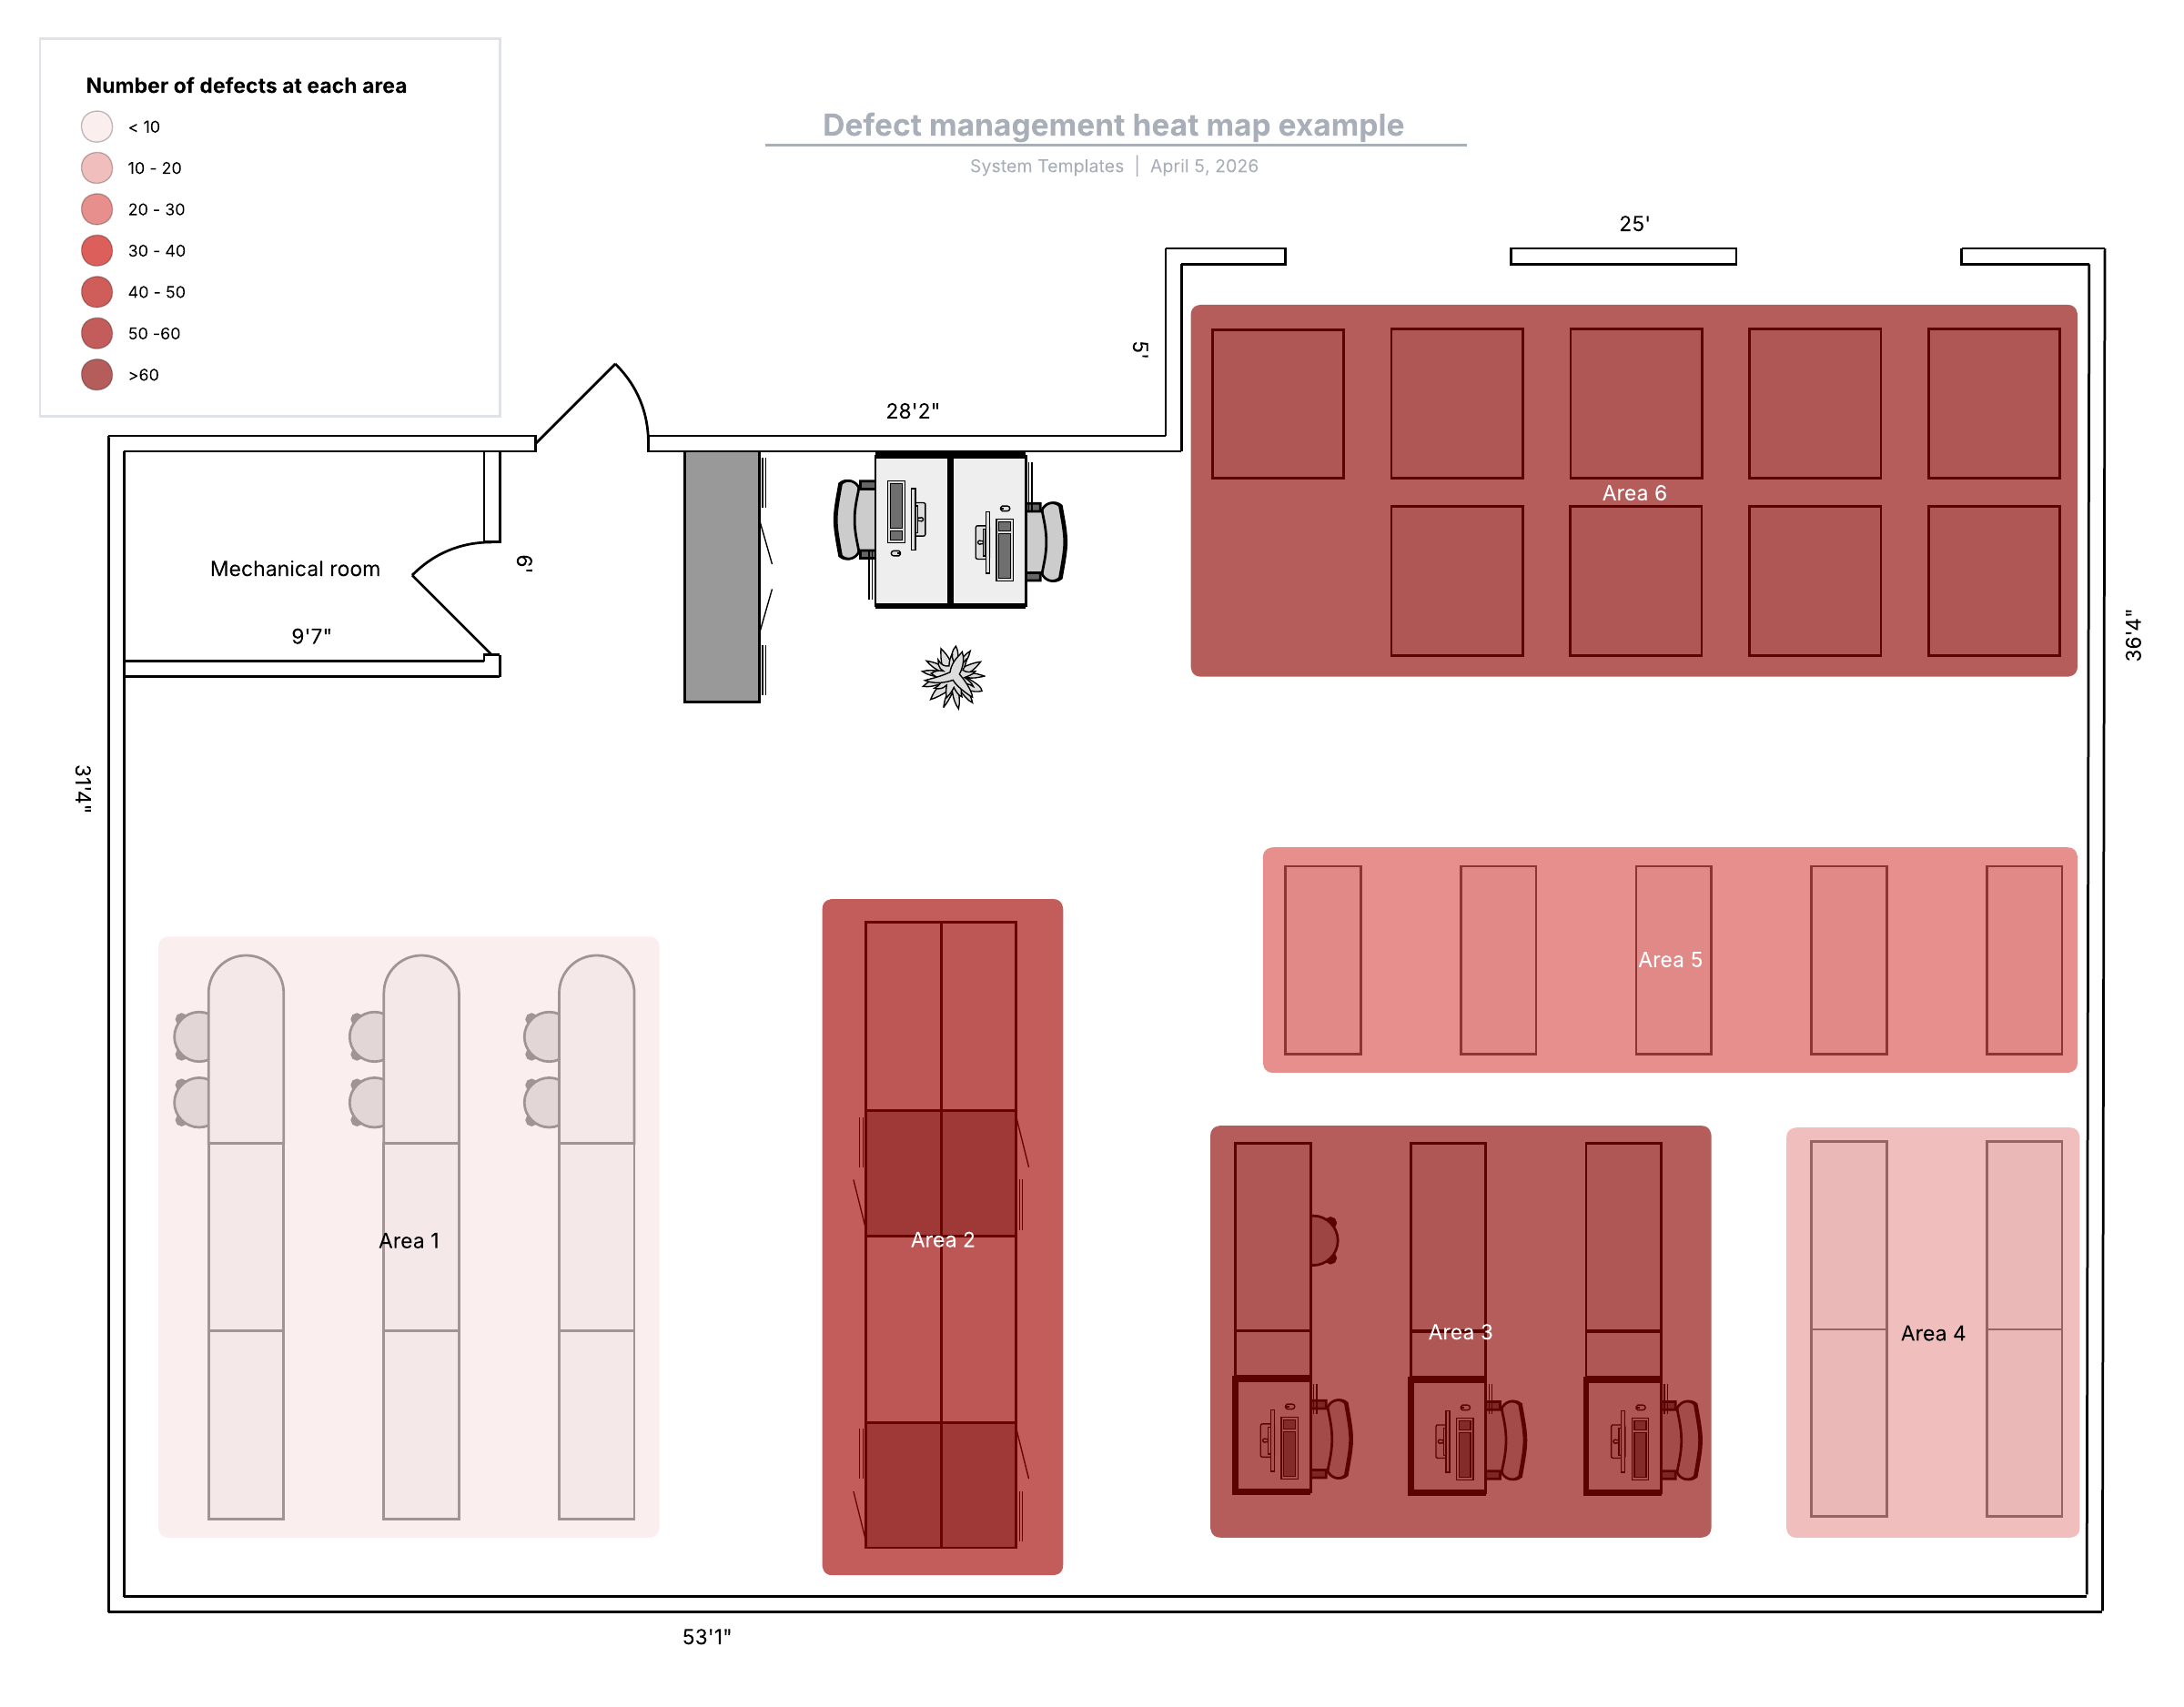
This defect management heat map example template can help you:
- Color-code your data.
- Determine the areas that are creating the most defects in your process.
- Make informed decisions.
Open this template to view a detailed example of a defect management heat map that you can customize to your use case.
Related templates
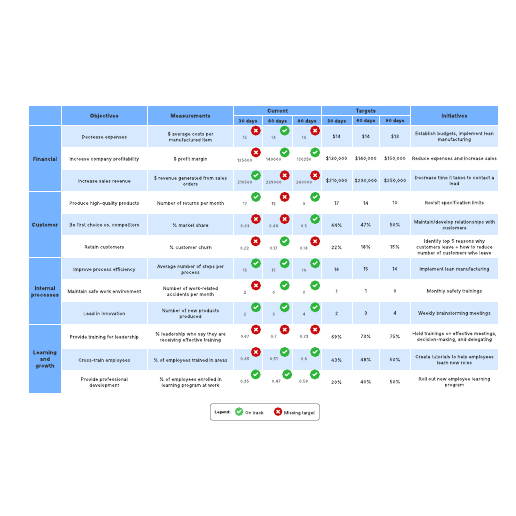
30-60-90 day balanced scorecard example
Used with:

Go to 30-60-90 day balanced scorecard example template
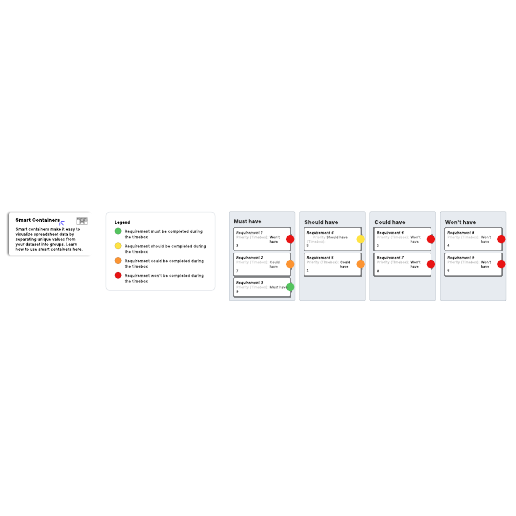
MoSCoW prioritization (for project/timebox)
Used with:
Go to MoSCoW prioritization (for project/timebox) template