Fishbone diagram for service industry example
This template works on the following products:

*For Team and Enterprise plans
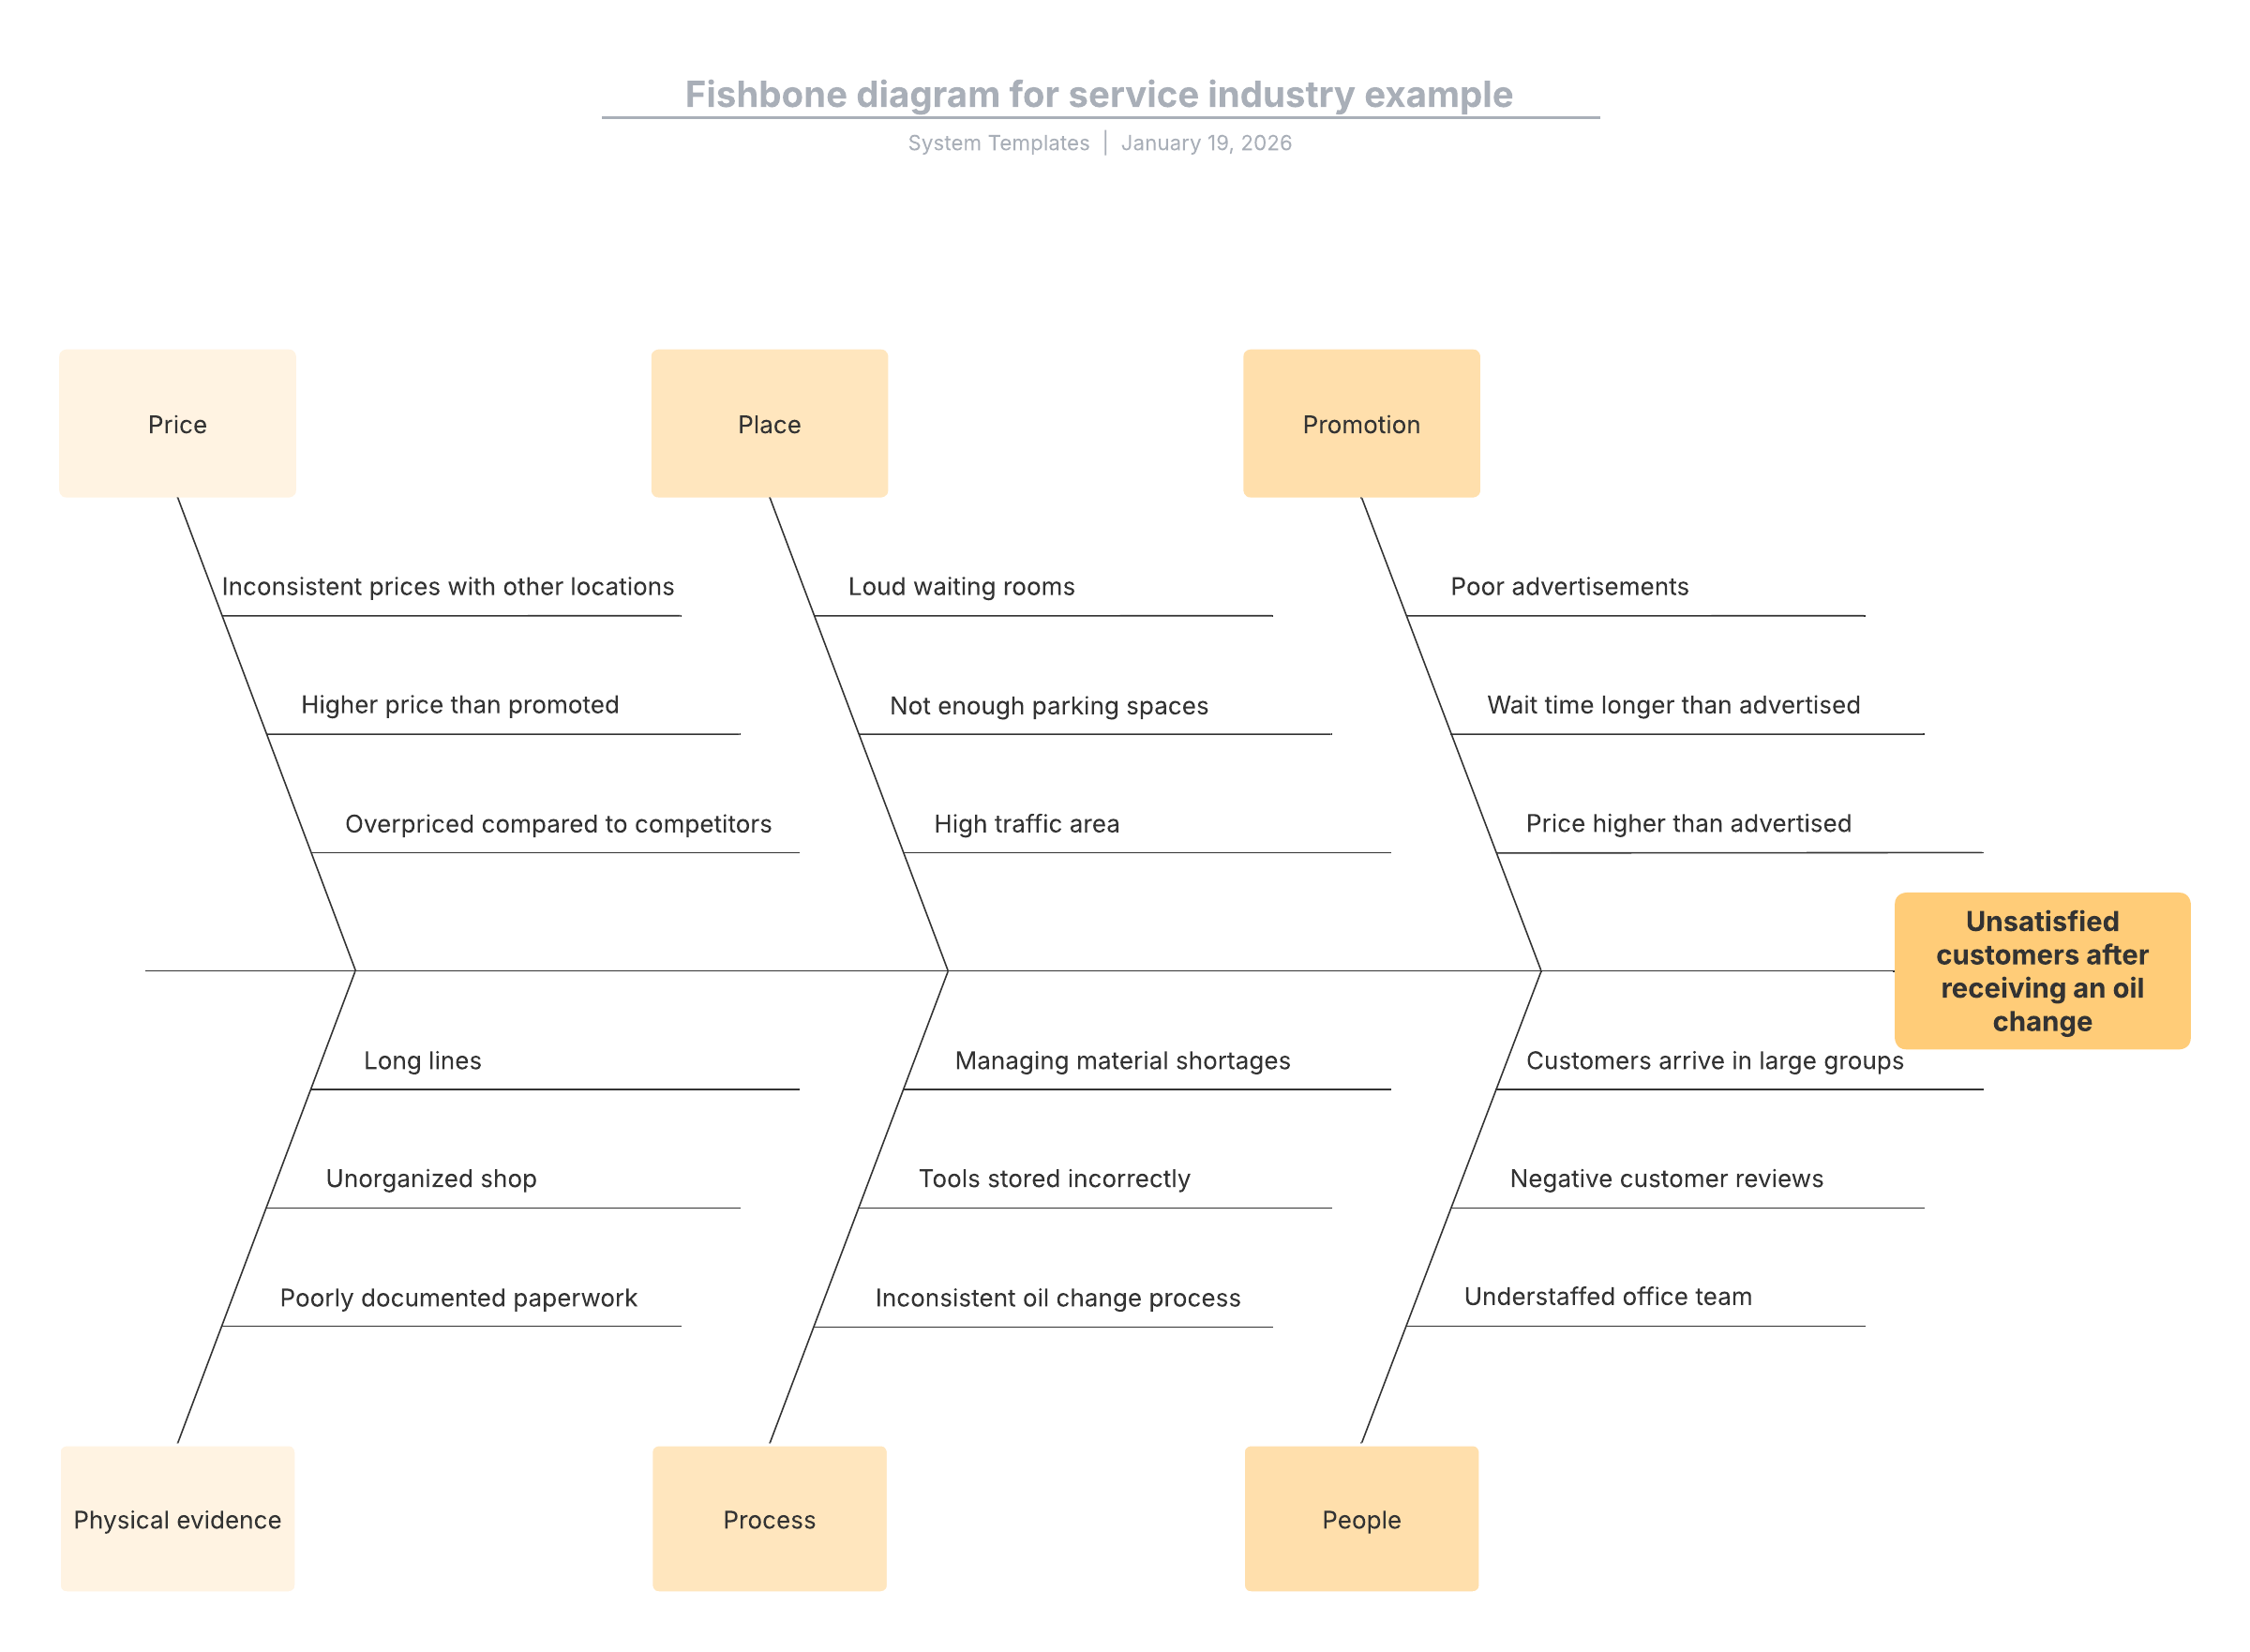
This fishbone diagram for service industry example template can help you:
- Identify potential causes behind an observed effect.
- Categorize the potential causes you identify.
- Collaborate with colleagues.
Open this template to view a detailed example of a fishbone diagram for service industry that you can customize to your use case.