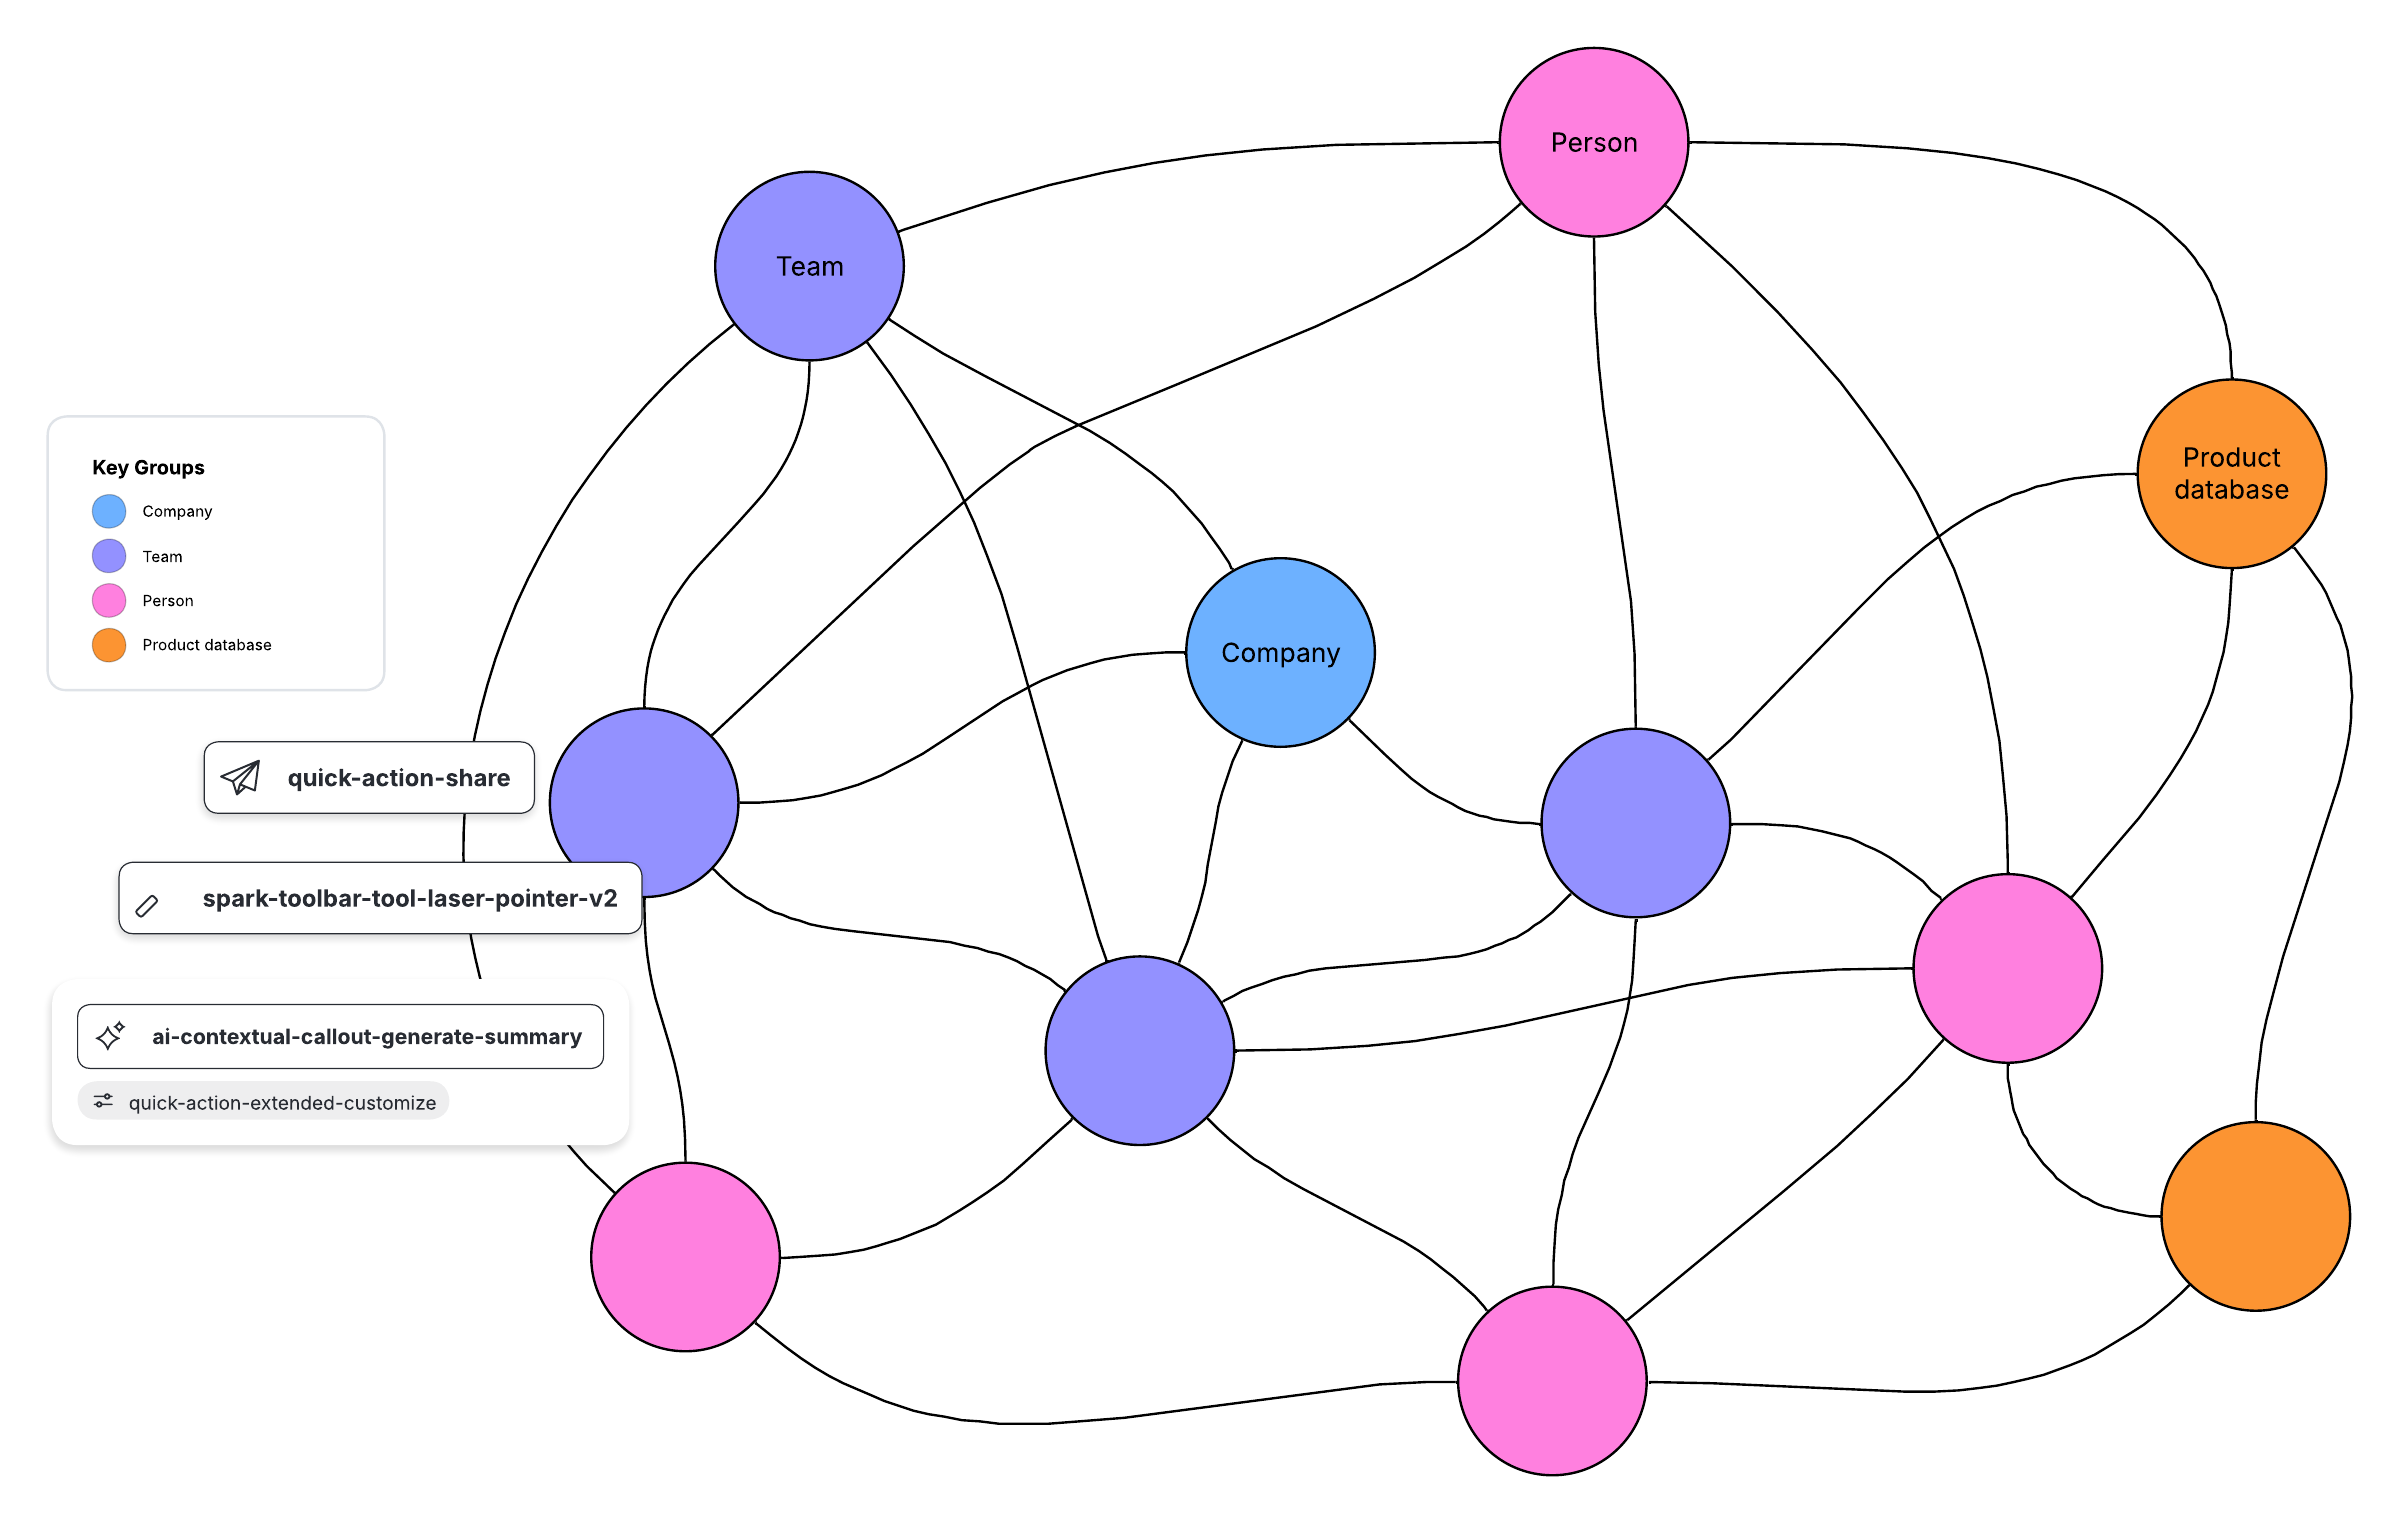
Social network diagram
This template works on the following products:

*For Team and Enterprise plans
This social network diagram template can help you:
- Visualize the relationships and interactions between people, groups, computers, and other various information entities.
- Identify and optimize areas for opportunity in your social network
- Design your own social network diagram.
Open this template to view a social network diagram example that you can customize to your use case.
What is the social network diagram template?
Social diagram networks display the relationships and interactions between entities, from people to computers. This template shows a basic social network diagram, color-coding information by group.
Benefits of using the social network diagram template
When you use the social diagram template, you can visualize relationships fully, allowing you to optimize your social network. Clean up redundancies and identify missing connections for more accurate systems.
Use this template to collaborate asynchronously or synchronously with others so you can align and collect feedback. The template itself can link to an existing data set for real-time updates, so you always have the most relevant information at your fingertips.
How to use the social network diagram template in Lucidchart
You can either edit the existing template to fit your use case or use it as inspiration and build your own from a blank canvas.
As you work, drag and drop the shapes you need from the toolbox onto the canvas. You can find specific shapes quickly by searching for the shape's name—just click on the magnifying glass in the top left corner. Label the shapes, or nodes, with each entity you’re mapping, and if necessary, label the lines that connect the shapes.
If you’d like to learn more about tables and other Lucidchart features, click on the button on the right of the document. It links to basic tutorials to help you get started.